How To Scrape SSRS Reports with Power Query
Warning: the below content is not approved by your IT administrator.
Once upon a time, data analytics and reporting were considered functions of IT more-so than finance or business administration departments. The result of this attitude (and perhaps available technology at the time) was that tools like Microsoft SQL Server Reporting Services (SSRS) were managed and developed by IT departments for consumption by finance teams. This was very popular software and I’ve seen it deployed in various client environments, particularly in government entities and companies that have been around for a long time.
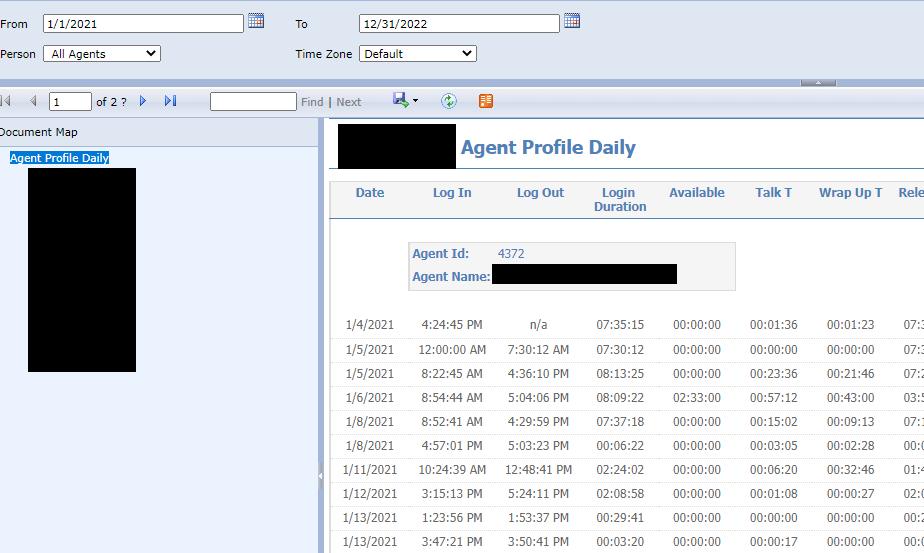
If you’re an IT person, you know what SSRS is. The name might not ring a bell to finance pros and spreadsheet warriors, but you may have interacted with it. See if the interface in these screenshots looks familiar.
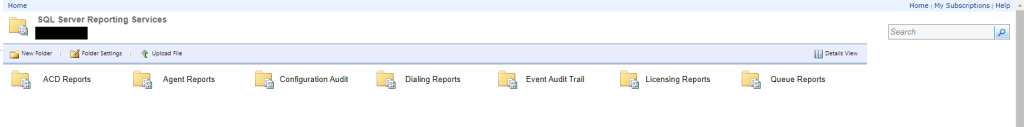
SSRS is a web based portal that allows you to run reports with selection criteria. These reports are usually created by IT people and there is not a ton of flexibility given to the users. So it shouldn’t be surprising that the most common use I see for SSRS reports with finance teams is to create a data source. If it couldn’t export to Excel then nobody would even bother to open it. So you find a good report, give it a broad selection criteria, export to Excel, and then continue your data processing and analysis. Wouldn’t it be nice to automate this with Power Query? Of course it would.
The reason I disclaimed that this post as not approved by IT is because the proper method for getting data for analysis is by connecting directly to the database and running queries against it. If you can’t do that, then you end up with SSRS as the reporting surface in between you and that precious database. So the IT guy will either laugh at your request to directly access the database, or scoff at your method of scraping this data with Excel. Either way, we’ll have to go through SSRS.
Reports can come in all kinds of designs and formats which can be downloaded in Excel format. For data modeling purposes, you’re probably better off exporting to CSV. If you know this is what you want, run the report with selection criteria that you will be happy with. After that, select the little orange button to export as a “data feed”.
This will download a file to your computer that ends with .atomscv (the atom file as I call it). This can be opened directly in Excel and the data can also be added directly to the Power Pivot data model. However, if you want to do transformations on the data or if you are using Power BI, then this method won’t really work. The atom file is still important, but we’ll need Power Query.
Power Query can read the atom file because it’s actually just a text file. You can open it in notepad and see it’s contents. It is an XML document that contains a URL. That URL can be used to download the report in your browser, but the encoding and formatting of it needs to be cleaned up a bit for Power Query to be able to use it. So save the atom file to your desktop, copy it’s file path, and paste it into the top line of the below query code. Run the query and BAM! The same data from the export to CSV option in SSRS should appear in Power Query.
let
    FilePath = "C:\Users\Jeremy\SSRS_Example.atomsvc",
    Source = Xml.Tables(File.Contents(FilePath)),
    Table0 = Source{0}[Table],
    Table = Table0{1}[Table],
    #"Changed Type" = Table.TransformColumnTypes(Table, {{"Attribute:href", type text}}),
    #"Attribute:href" = #"Changed Type"{0}[#"Attribute:href"],
    #"Clean Ampersands" = Text.Replace(#"Attribute:href", "amp;", ""),
    #"Change to CSV Format" = Text.Replace(#"Clean Ampersands", "Format=ATOM", "Format=csv"),
    Request = Excel.Workbook(Web.Contents(#"Change to CSV Format"))
in
    Request
That’s the gist of it and will hopefully serve your needs, but I have some tips for further development and more advanced queries. The atom file defines the report exactly as you ran it in your web browser with the selected criteria. If you want to query data based on different criteria you have a few options.
- Download a new atom file from SSRS with the new criteria selected and replace the old file.
- If you need to use multiple different selection criteria then download the several different atom files, create a function with the above code, and invoke it over a list of atom file paths.
- Inspect the URL used in the web request. You will see that the URL string contains the parameters and arguments defining the query which match the selection criteria used when generating the atom file. You can use Power Query text functions to swap out different arguments and it will pull data as if you had selected different criteria. This is the most advanced option, but of course it’s also the coolest when you get it working.